
The past does not equal the future however, it’s as good a barometer as any when it comes to making attempts to predict it.
Looking and analysing the past 5 general elections I have made some interesting discoveries on the before and after a general election and how this affects the property market…if at all.
Out of the five general elections (1997, 2001, 2005, 2010, 2015) two were not certain (2010 with the coalition government of Lib-Dems and Conservatives and 2015 with the surprising Tory majority). So I wanted to compare what happened to the number of houses sold and prices achieved between the three certain elections (1997, 2001 and 2005) against the unexpected ones of 2010 and 2015.
Look at the first graph below comparing the number of properties sold and the dates of the general elections….
![]()
Looking at the number of monthly transactions (the blue line), there is a certain pattern to the housing market. That pattern has never changed since 1995 (meaning the periodic fluctuations that occur regularly based on a pattern – i.e. you can see how the number of properties sold dips around Christmas, rises in Spring and Summer and drops again at the end of the year).
The red line is a 12 month ‘moving average’ trend line which enables us to look at the ‘de-seasonalised’ housing transaction numbers, whilst the yellow arrows indicate the times of the general elections. It is clear to see that after the 1997, 2001 and 2005 elections, there was significant uplift in the number of households sold, whilst in 2010 and 2015, there was a slight drop in house transactions.
The next thing I did was to consider what happened to property prices. In the graph below, I have used that same 12-month average, housing transactions numbers (in red) and yellow arrows for the dates of the general elections but this time compared that to what happened to property values (pink line).
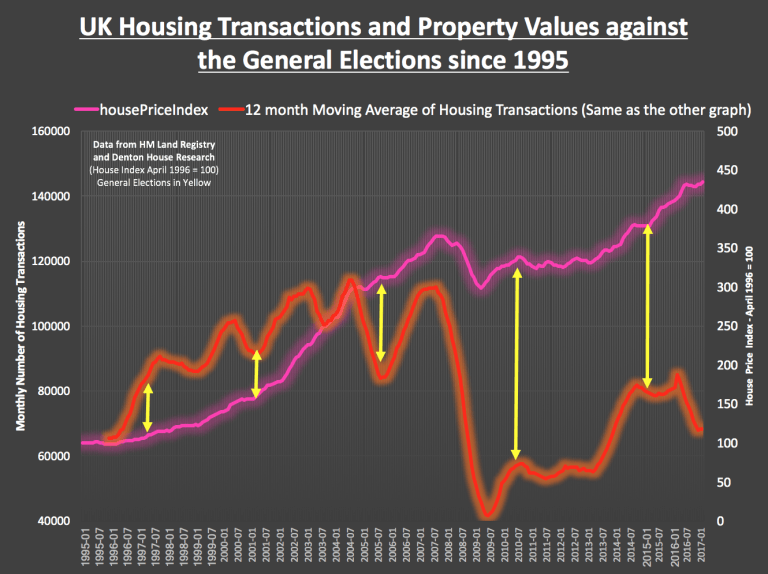
It is quite clear none of the general elections had any effect on the property values. Also, the timescales between the calling of the election and the date itself also means that any property buyer’s indecisiveness and indecision before the election will have less of an impact on the market.
So finally, what does this mean for the landlords of the 20,380 privately rented households in Walsall? Well, as I have discussed in previous articles (and just as relevant for homeowners as well) property value growth in Walsall will be more restrained in the coming few years for reasons other than the general election. The growth of rents has taken a slight hit in the last few months as there has been a slight over supply of rental property in Walsall, making it imperative that Walsall landlords are realistic with their market rents (I’ve seen properties on the market with asking prices inflated by 20%!!). But, in the long term, as the younger generation still choose to rent rather than buy … the prospects, even with the changes in taxation, mean investing in buy-to-let still looks a good bet.
If you see a Walsall property you think will make a good buy-to-let and need a second opinion, send me the Rightmove or Zoopla link. As my readers will attest, I don’t charge for an opinion.
Phone: 01922 311016
Email: salekm@ashmorelettings.co.uk
